RapidLog On-Demand
3/18/2010 - Enhanced violation chart
Charts now have a title at the top of each chart window. This title bar shows the name of the chart you are currently viewing as well as the date range of the data.
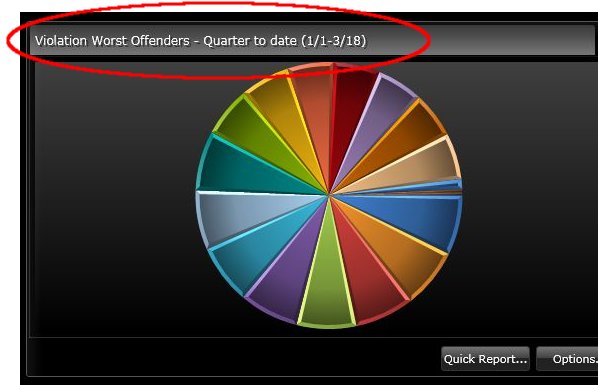
On the violation worst offenders chart, you can now click on an individual driver to be taken to a break-down of his or her violations. The drill-down chart shows the percentages of each violation type for that driver over the specified time period.
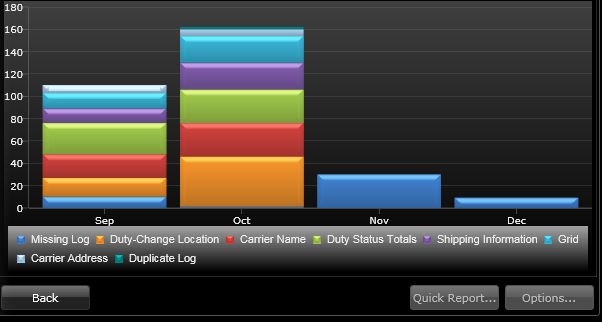
After clicking on a driver to view the drill-down chart for violation percentages, you can go one step further and view a history of that driver's performance. Clicking on the "View History" button will display the last 6 months worth (or however much you have) of violations by month broken down by type. This overview can help you determine whether a driver's poor performance recently is an anomaly or is indicative of a pattern.
<< Back